
01 · Onboarding and customer state
Organization, user, and migrated customer records entered one application boundary.
Customer work · Banking and financial services
Post-trade users relied on connections spread across applications built by different teams and inherited through two decades of organizational change. BluePi designed one platform for onboarding, connection status, service monitoring, trading-partner visibility, and alerts.
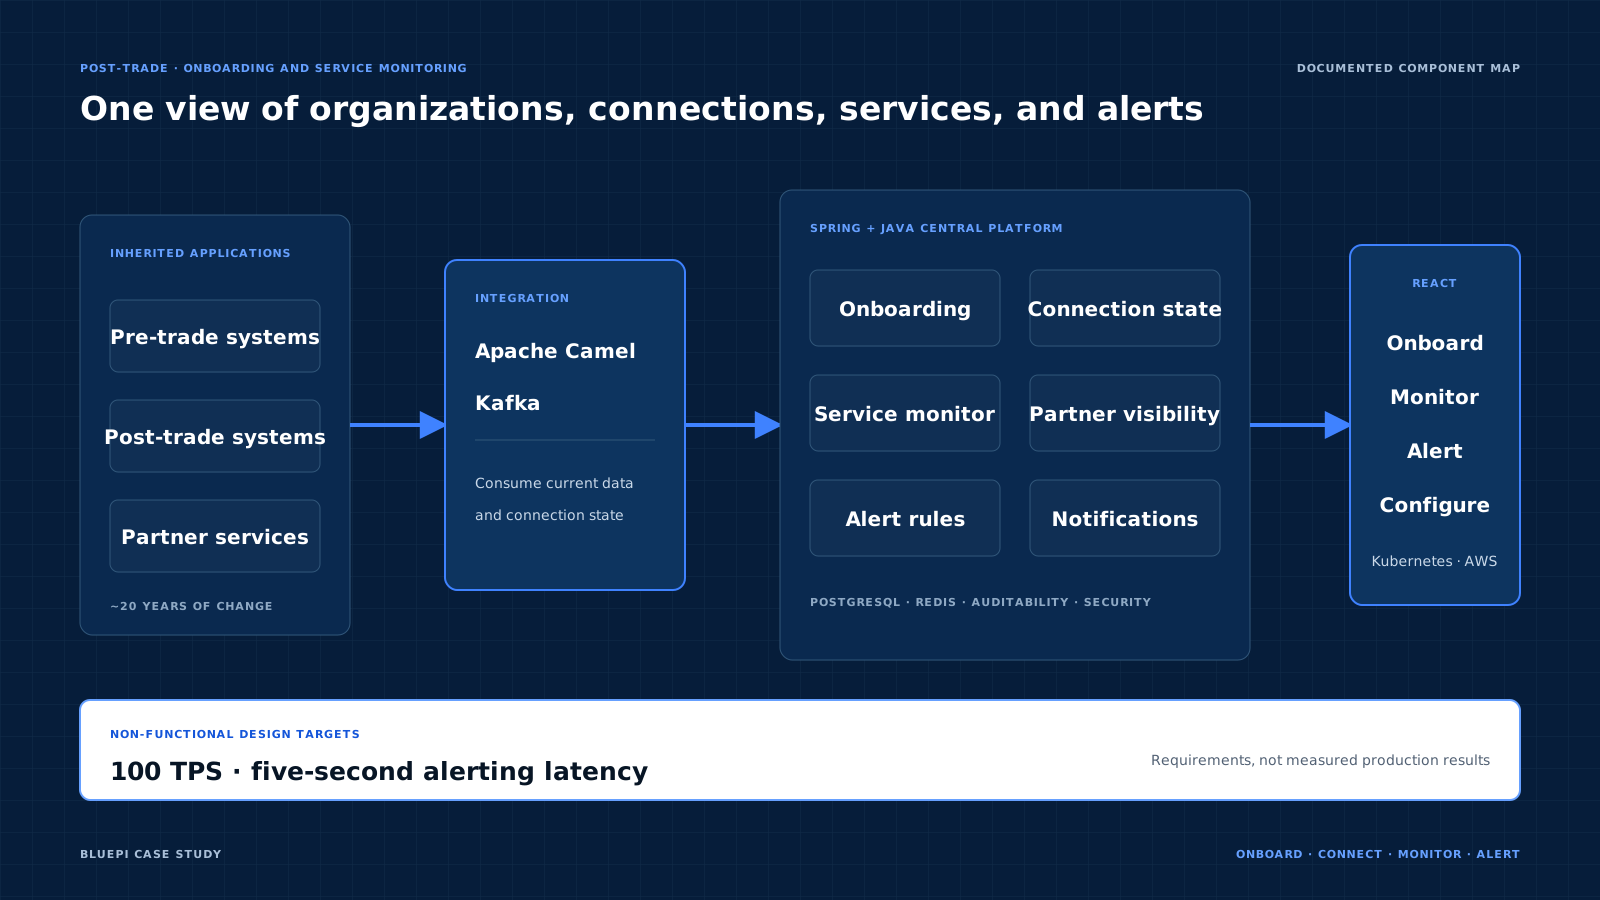
Pre-trade and post-trade processing depended on connected applications built by separate teams and inherited through mergers and acquisitions over approximately 20 years. BluePi built a central platform for onboarding, application data, connection status, service monitoring, trading-partner visibility, alerts, and user-selected notifications.
01 · Onboarding and customer state
Organization, user, and migrated customer records entered one application boundary.
02 · Inherited application signals
Adapters and events moved current connection and service state from existing applications into the central platform.
03 · Configurable alert routes
Monitoring views, alert rules, and notification destinations connected service-status changes to an operating response.
BluePi centralized onboarding records, connected inherited applications through adapters and events, modeled current connection and service status, and routed selected alerts to user-defined destinations.
Organization, user, and migrated customer records entered one application boundary.
Adapters and events moved current connection and service state into the central platform.
Monitoring views, alert rules, and notification preferences connected status to an operating response.
Where this pattern fits
This case is relevant when customer onboarding and connection health are distributed across inherited systems, but users and operations teams need one status model.
Use these prompts to decide whether the case fits your operating problem and what a first deployment should prove.
A first engagement can centralize one organization and user path, connect one application’s service status, expose one monitoring view, and validate one alert route end to end.
Open a section to review the customer problem, implementation, business change, and architecture.
Customer and connection data remained distributed across siloed applications. Users had no single place to see whether onboarding was complete or whether a connection was available. A failure could interrupt trade-information exchange and create financial or regulatory consequences.
BluePi built a centralized application that brought organization and user onboarding together with connection status, service monitoring, trading-partner visibility, and configurable alerts.
Apache Camel adapters and Kafka connected current applications to Spring and Java services. PostgreSQL and Redis supported controlled state. React provided the onboarding and monitoring interface, with Kubernetes on AWS as the documented runtime stack.
The platform was designed for 100 transactions per second and five-second alerting latency, with auditability and security built into the system boundary.
Users and operations teams gained one application for reviewing onboarding, connection status, service health, and alerts across the inherited application estate.