
01 · Manual stock decisions
Inventory decisions required teams to compare sales, stock, product, and store information manually. The same network could experience stockouts in one location and excess inventory in another.
Customer work · Retail and consumer
BluePi built a recurring forecasting and recommendation cycle for ordering, reordering, distribution, and redistribution. In one category, same-store sales grew 11 percent, the safety-stock factor moved from 2.5 to 1.5, and raw-material planning extended to nine months.
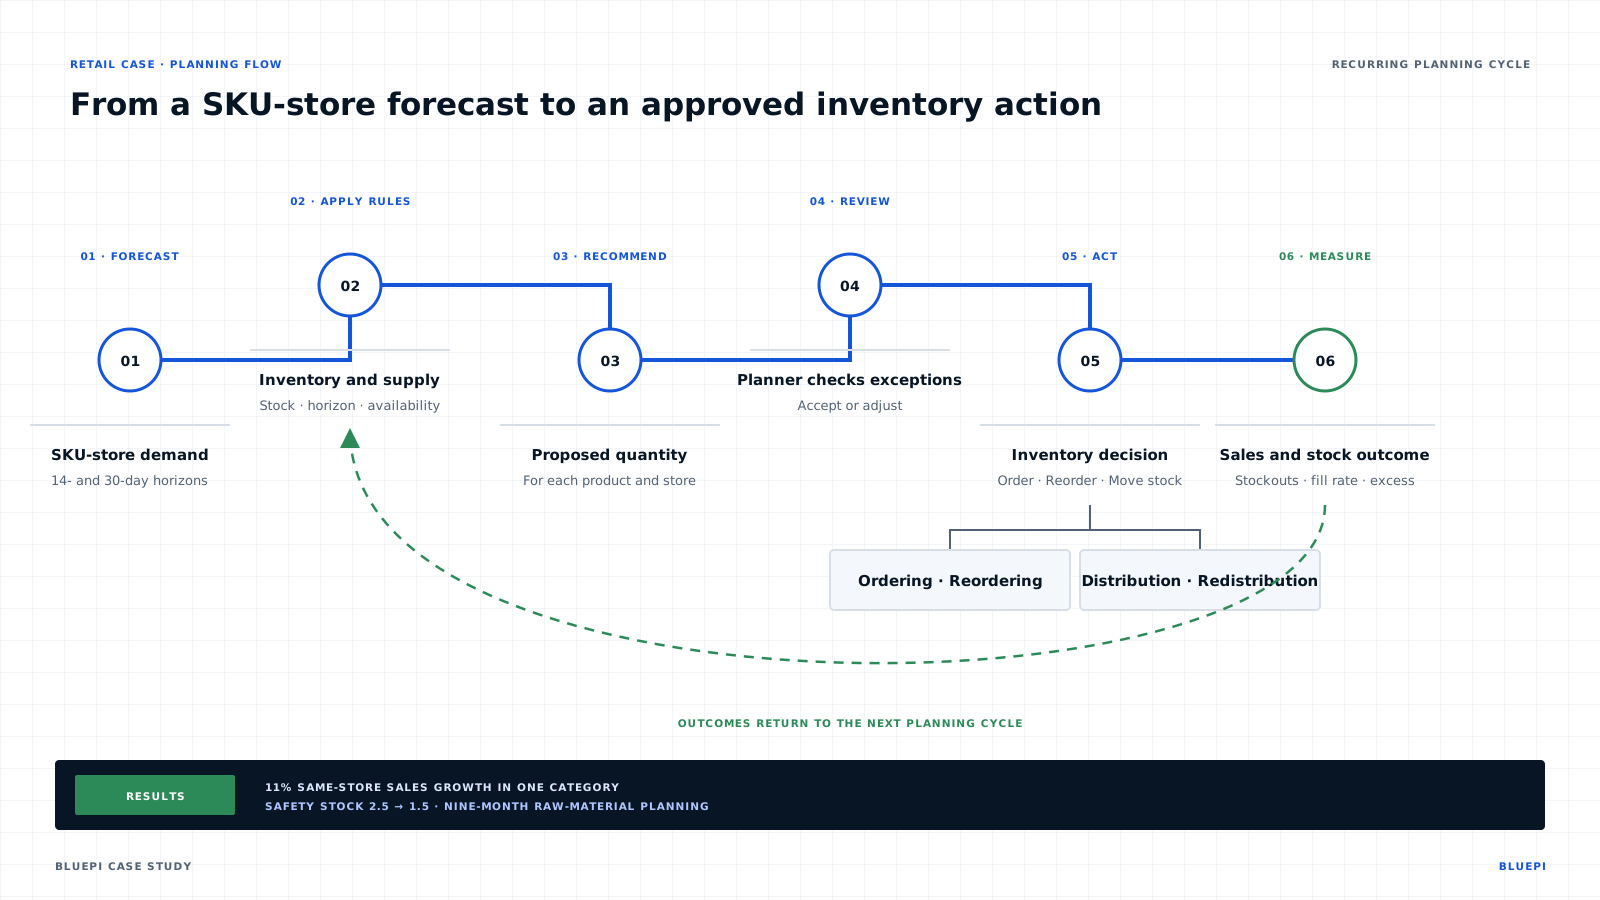
The retailer managed ordering and inventory balancing across a large product and store network. BluePi connected forecasts to the actions planners needed to take: order, reorder, distribute, or move stock between stores.
01 · Manual stock decisions
Inventory decisions required teams to compare sales, stock, product, and store information manually. The same network could experience stockouts in one location and excess inventory in another.
02 · SKU-store planning cycle
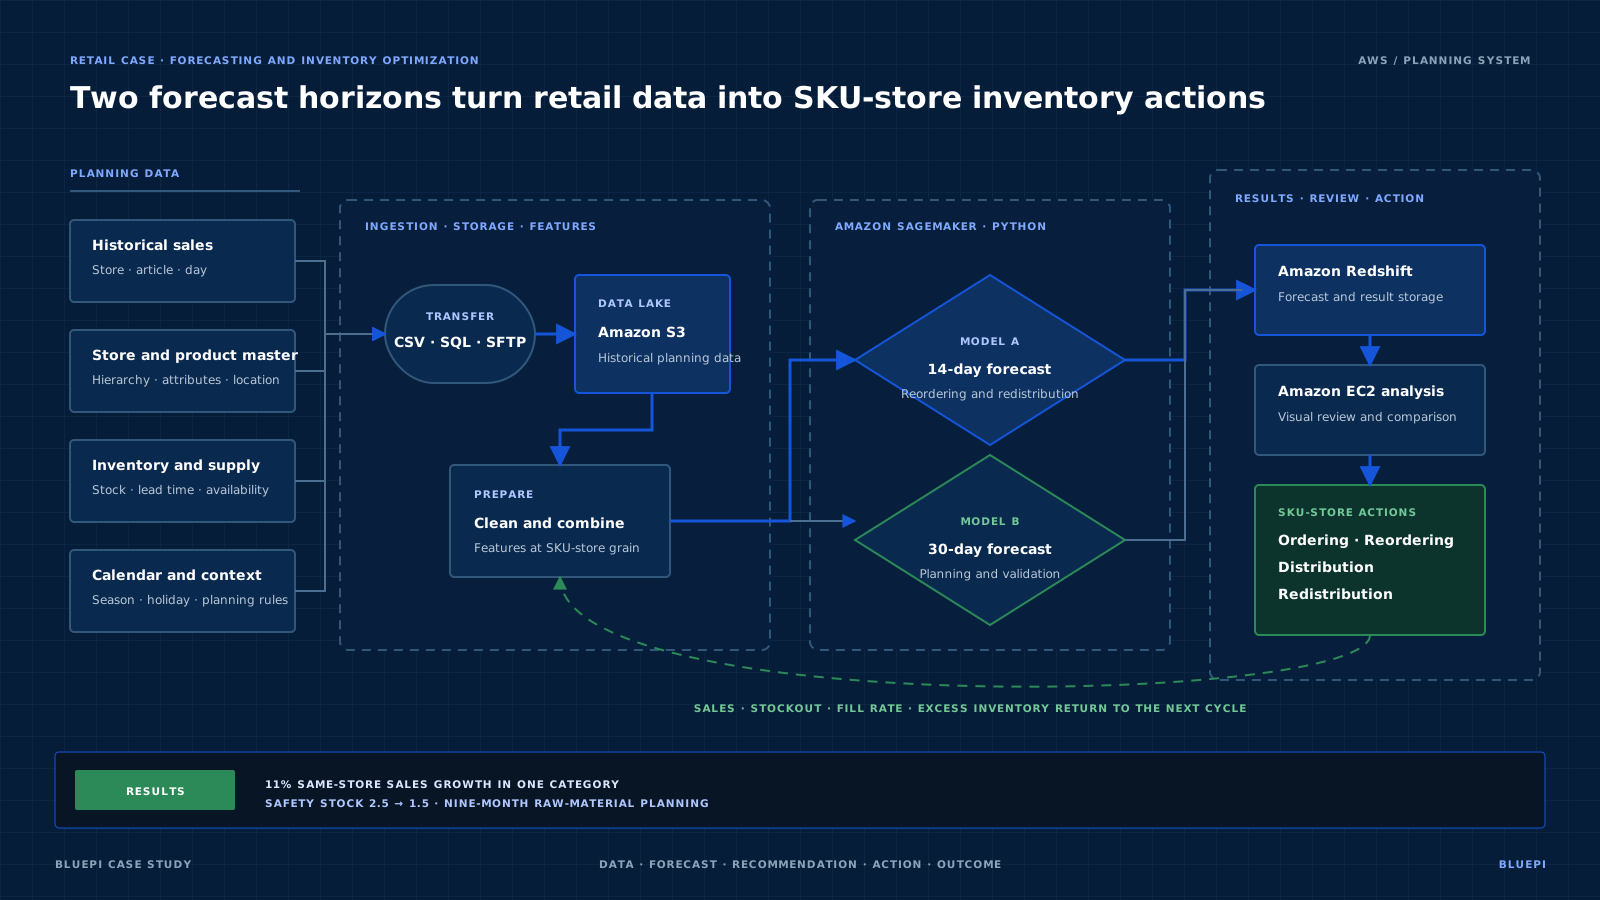
An AWS-based forecasting system produced demand estimates by SKU and store across short planning horizons. The workflow converted those estimates into recommendations for reordering and redistribution.
03 · Sales and safety stock
In one category, same-store sales grew 11 percent. The safety-stock factor moved from 2.5 to 1.5, and raw-material planning extended to nine months.
The system joined sales, stock, product, and store data, generated SKU-store forecasts, converted them into ordering and redistribution recommendations, and connected planner action to later inventory outcomes.
The models produced forecasts for individual products and stores so portfolio averages did not hide weak recommendations at specific locations.
Separate 14-day and 30-day forecasts supported reordering, redistribution, and decisions with longer supply lead times.
Teams compared recommendations with later sales, stockout days, fill rates, and excess inventory to identify where the model, planning rule, or execution process needed attention.
Where this pattern fits
This pattern fits retailers that manage inventory across many stores and products but still rely on manual analysis for reordering and redistribution. A useful starting point is one representative product group, a fixed set of stores, and a planning cycle with measurable stock and sales outcomes.
Open a section to review the customer problem, implementation, business change, and architecture.
The retailer needed to balance product availability against excess inventory across a distributed store network.
BluePi connected source data, forecasting, recommendation logic, planner review, and post-live measurement.
The retailer moved from manual inventory analysis to a recurring forecasting and recommendation cycle across multiple product categories.