
Good fit
One operating workflow has a named owner, a measurable baseline, and users who can judge whether the result improves.
Measure to action
BluePi turns source data into trusted measures and decision-ready analytics for operating and leadership teams.
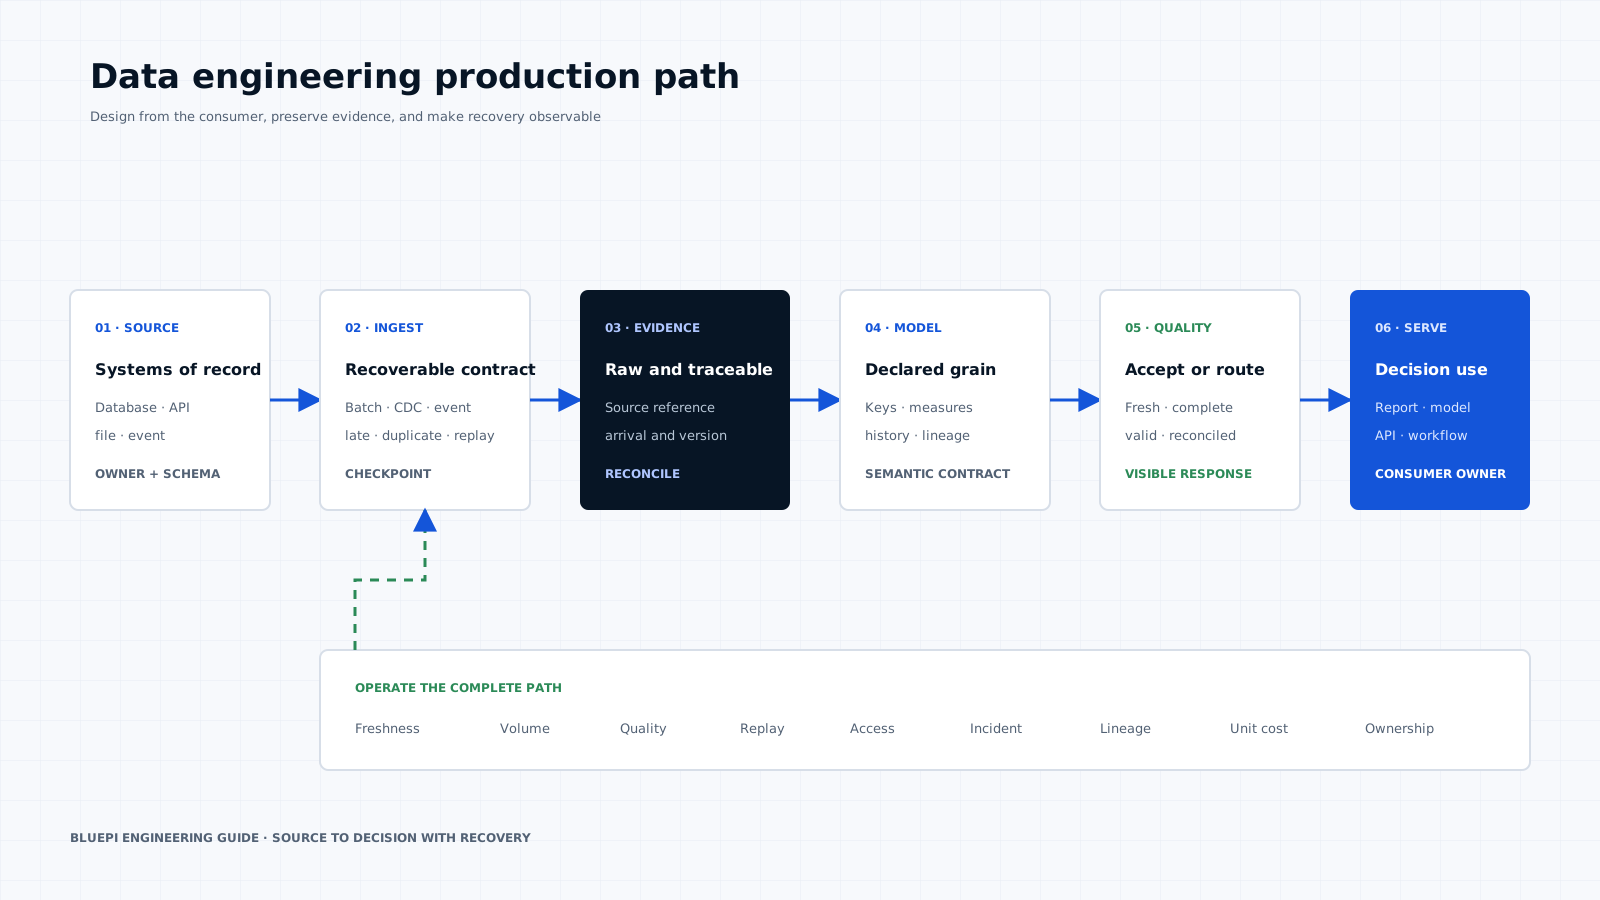
For teams that need trusted measures and faster action
BluePi has delivered executive reporting, operational analytics, self-service data, and large analytical platforms across retail, logistics, manufacturing, financial services, and consumer operations.
The work starts with the decisions a report or alert must support. Metric definitions, source grain, refresh, access, performance, and ownership are established before presentation choices take over.
When this is the right starting point
Good fit
One operating workflow has a named owner, a measurable baseline, and users who can judge whether the result improves.
Poor fit
The request is capacity-only staffing, an unowned demonstration, or a broad transformation without a first decision and finish condition.
Evidence produced during delivery
01
Teams define the grain, formula, source, freshness, owner, and accepted use for each important metric. The BI architecture then connects source reconciliation, semantic models, serving performance, access, refresh, and report ownership around those definitions.
02
Semantic models, access controls, performance design, refresh monitoring, and report ownership keep analytics consistent after launch.
03
BluePi adds predictive or prescriptive methods when the decision and baseline justify them. The delivery defines evaluation, workflow integration, user review, monitoring, and outcome measurement before a model enters the reporting path.
04
Where useful, BluePi connects measures and alerts to the application, planning, service, or operational process that uses them.
We will review the owner, the baseline, the data path, the system boundary, and the route to go-live.
Discuss one workflow