
01 · Broad demand averages
Stores prepared from experience and broad averages. Teams could not see how many orders of each type were likely during the next operating interval.
Customer work · Quick-service restaurants
BluePi built store-level order and ingredient forecasts for every hour of the operating day. Restaurant teams used the forecast to prepare earlier, adjust for local conditions, and reduce food waste.
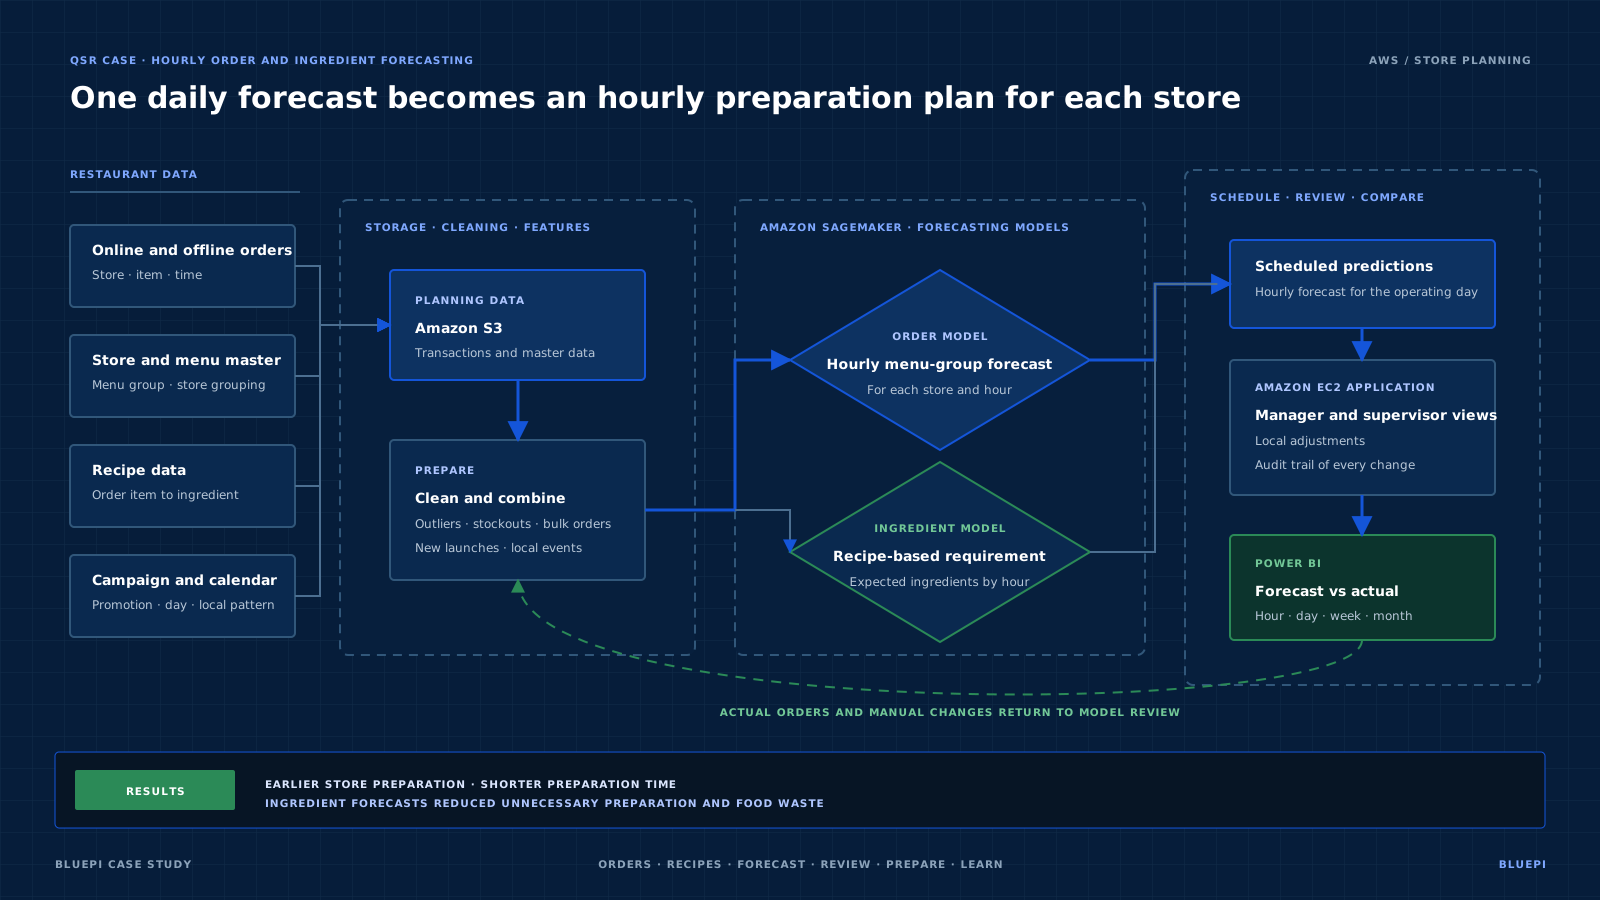
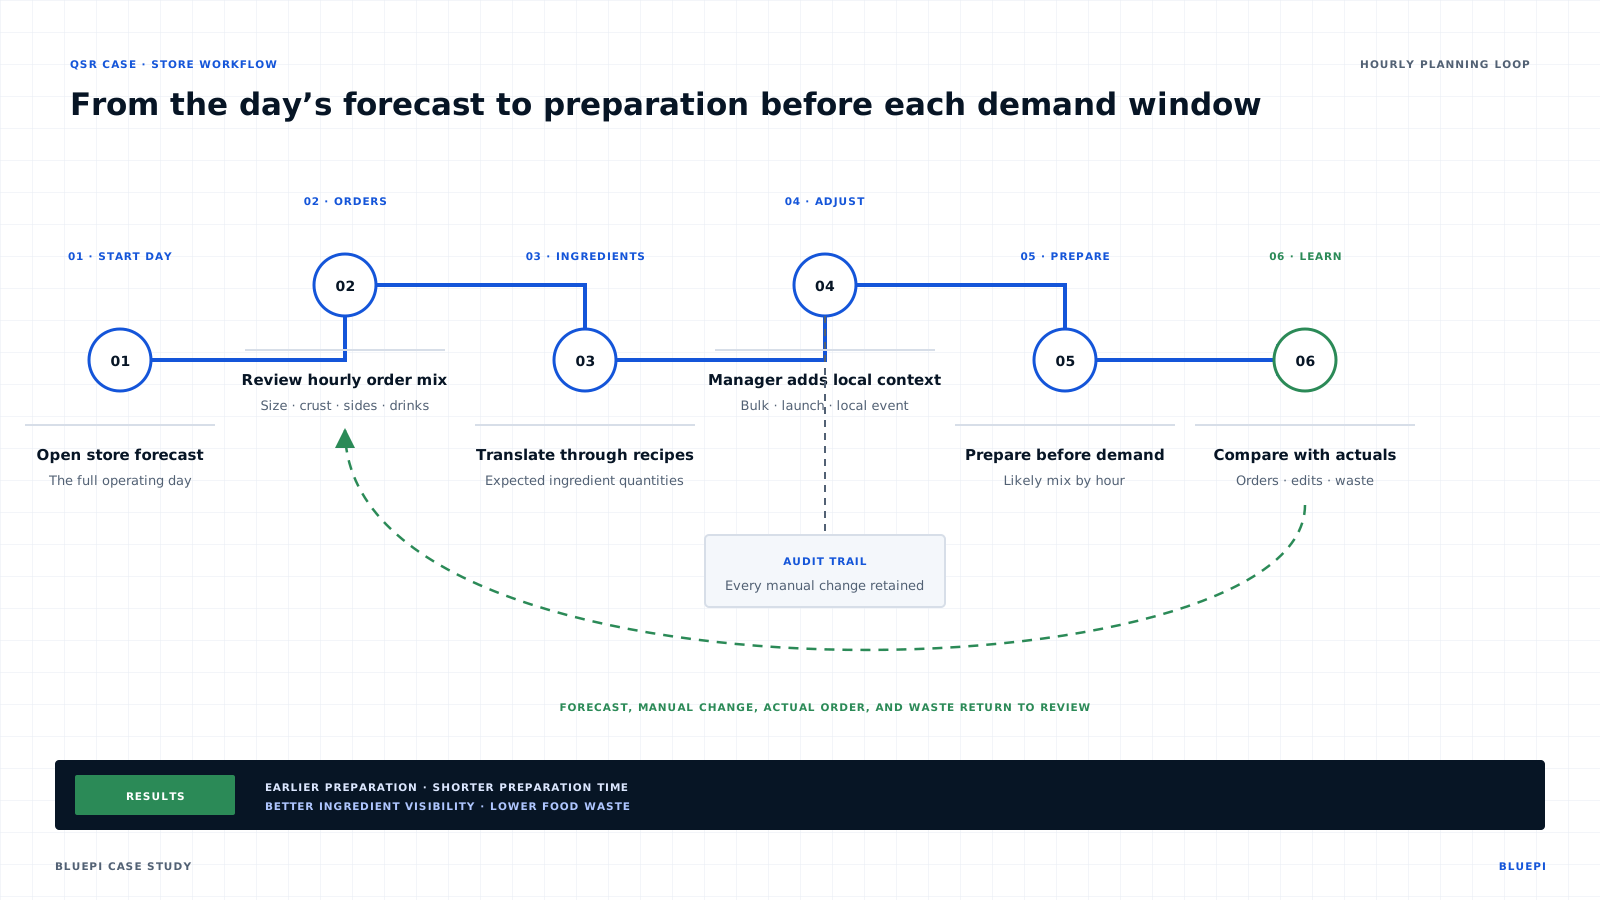
Restaurant teams needed to prepare ingredients before demand arrived, but daily or weekly averages could not describe the order mix for the next hour. BluePi connected order history, store data, menu information, and recipes to hourly order and ingredient forecasts.
01 · Broad demand averages
Stores prepared from experience and broad averages. Teams could not see how many orders of each type were likely during the next operating interval.
02 · Hourly store forecasts
A forecasting system generated hourly order and ingredient estimates for each store. A store application let managers review and adjust the forecast before preparation began.
03 · Preparation time and food waste
The system became part of the daily planning process for an initial store group. Earlier preparation reduced order preparation time, while a better view of ingredient demand reduced food waste.
Order history, store data, menu information, and recipes produced hourly order and ingredient forecasts. Store managers reviewed and adjusted the forecast before teams prepared for the next demand window.
Every store received its own hourly forecast so local demand patterns remained visible instead of being hidden by one network-level average.
Recipe data converted expected orders into ingredient quantities so teams could prepare the likely mix before the demand window began.
Managers could account for bulk orders, new launches, and local events. The system retained an audit trail so evaluation could distinguish model output from manual changes.
Where this pattern fits
This pattern fits restaurant networks where preparation decisions happen before short demand windows and where one network-level forecast hides local variation. A useful starting point is a representative store group with enough normal days, peaks, promotions, and local events to test the complete planning cycle.
Open a section to review the customer problem, implementation, business change, and architecture.
Restaurant teams needed an earlier and more precise view of hourly demand.
BluePi connected order history, forecasting models, store review, and forecast evaluation.
The forecasting system became part of the daily planning process for the initial store group.