
01 · Fragmented sales reporting
Primary-sales reports were assembled manually, secondary sales remained difficult to see, departments worked from conflicting numbers, and slow dashboards limited analysis.
Customer work · Retail and consumer
A beverage bottler lacked a consistent view of primary sales, secondary sales, inventory, finance, assets, and distribution. BluePi integrated SAP and commercial data on a governed cloud platform and automated reporting.
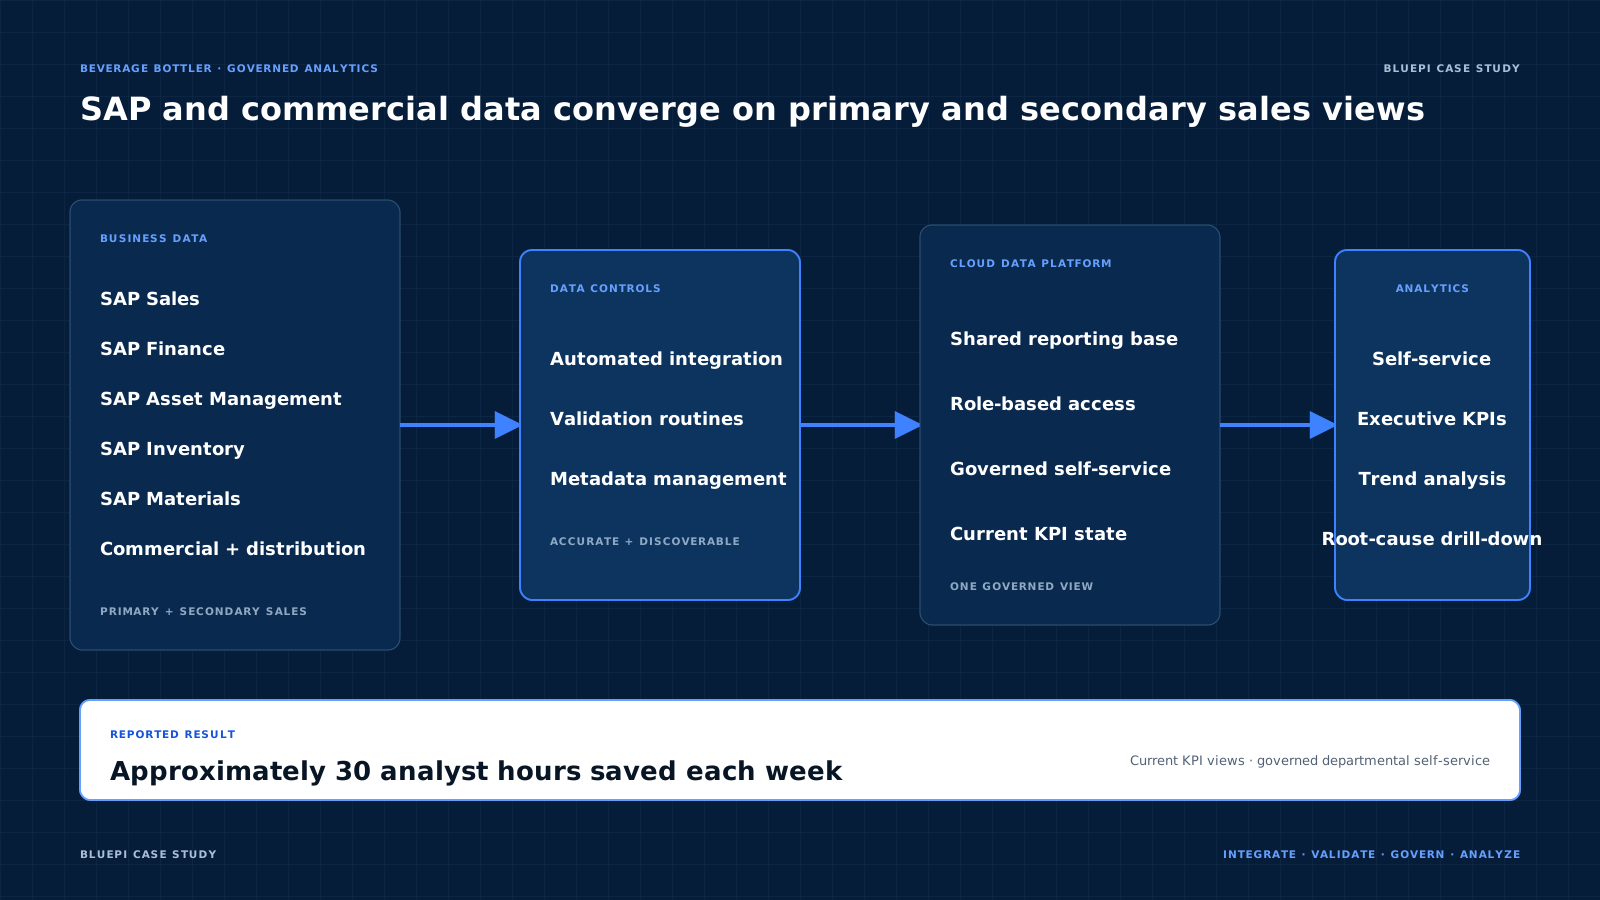
Primary sales, secondary sales, inventory, finance, assets, and distribution were reported through separate processes. BluePi connected SAP and commercial data on a governed cloud platform so departments and leaders could work from shared measures.
01 · Fragmented sales reporting
Primary-sales reports were assembled manually, secondary sales remained difficult to see, departments worked from conflicting numbers, and slow dashboards limited analysis.
02 · Governed SAP analytics
A central cloud platform integrated SAP Sales, Finance, Asset Management, Inventory, and Materials data with commercial and distribution sources. Automated validation, metadata, role-based access, self-service reporting, and drill-down dashboards governed use.
03 · Analyst time and shared views
Reporting automation saved approximately 30 analyst hours each week. Departments could build governed reports, while leaders gained current primary- and secondary-sales views with drill-down analysis.
BluePi connected integration, validation, metadata, access, and dashboard design so teams could use shared measures without rebuilding the same reports.
Primary sales, secondary sales, inventory, and finance data entered a shared analytical model.
Validation and metadata controls helped users understand whether a measure was ready for decision use.
Role-based access gave teams room to explore while retaining approved definitions and protection for sensitive data.
Where this pattern fits
This case is relevant to consumer businesses with strong reporting demand and fragmented sales or distribution data. BluePi can begin with one commercial decision and the measures required to support it.
Open a section to review the customer problem, implementation, business change, and architecture.
Primary-sales reports were assembled manually, secondary sales remained largely invisible, and departments worked from conflicting numbers. Slow dashboards limited the use of data for demand, placement, pricing, inventory, and distribution decisions.
BluePi integrated SAP Sales, Finance, Asset Management, Inventory, and Materials data with commercial and distribution data on a central cloud platform. Automated validation, metadata, role-based access, self-service analytics, and drill-down dashboards governed the reporting path.
Reporting automation saved approximately 30 analyst hours each week. Departmental users could build governed reports, while leadership gained current primary- and secondary-sales views with drill-down for root-cause analysis.
SAP business modules and commercial systems fed automated integration and validation into a central governed cloud data platform. Metadata and role-based access supported self-service reports, executive dashboards, and primary- and secondary-sales analysis.
Departments gained a shared reporting base and could create governed views without waiting for repeated manual assembly. Leadership could move from current KPIs into the underlying sales, inventory, finance, and distribution detail.