
01 · Inspectable sales drivers
Store data, exploratory analysis, and dashboards connected sales movement to measurable operating and external factors.
Customer work · Quick-service restaurants
Yum Brands needed to understand changing sales drivers and test response scenarios during a period of rapid demand disruption. BluePi built a cloud analytical path with SQL Server, Amazon EC2, Amazon EMR, and Power BI and released it in a matter of weeks.
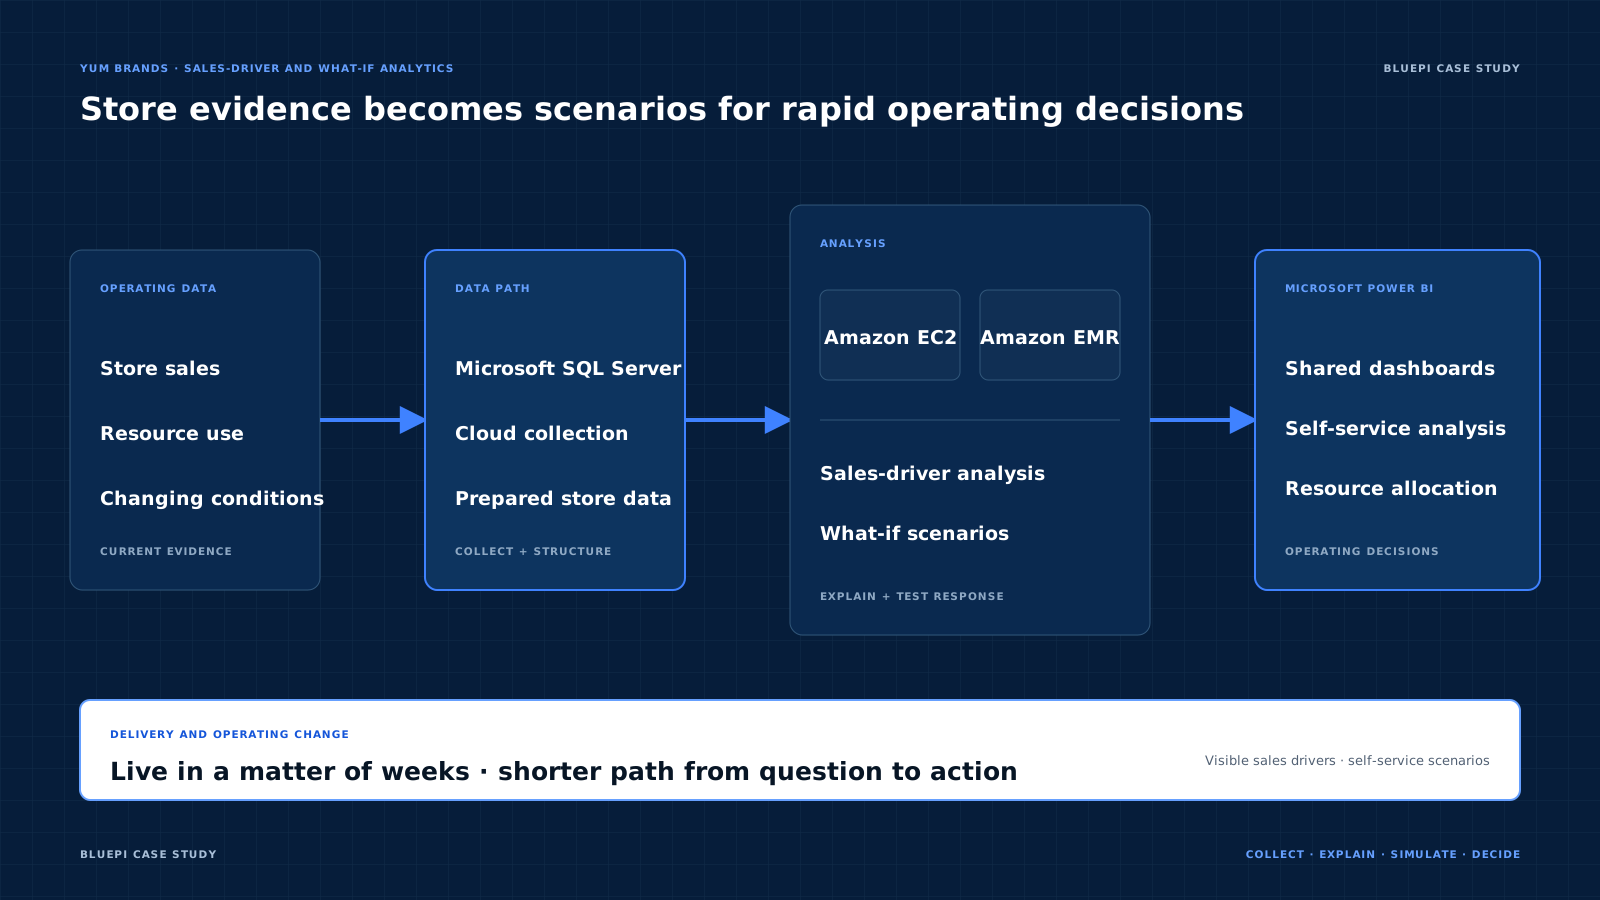
Yum needed analysts and leaders to understand shifting sales drivers and test responses while trading conditions changed week by week. BluePi and Yum created a cloud-based analytical platform with Power BI, SQL Server, AWS EC2, and EMR.
01 · Inspectable sales drivers
Store data, exploratory analysis, and dashboards connected sales movement to measurable operating and external factors.
02 · What-if response testing
What-if analysis let teams examine plausible actions and compare likely outcomes before allocating resources.
03 · Broader dashboard use
The solution went live in weeks, broadened dashboard adoption, sped analysis, improved resource-allocation decisions, and supported business continuity.
BluePi and Yum brought store data into a cloud analytical platform, supported exploratory analysis, presented dashboards in Power BI, and added what-if analysis for staffing, inventory, and resource-allocation decisions.
The analytical view connected changes in sales to measurable operating and external factors.
What-if analysis let teams examine plausible responses and compare likely outcomes.
Accessible reports and exploratory paths increased the number of people who could work with the evidence directly.
Where this pattern fits
This case is relevant when planning assumptions are moving faster than the normal reporting cycle. BluePi can build a bounded decision model around one volatile measure and the actions it controls.
Open a section to review the customer problem, implementation, business change, and architecture.
Yum Brands needed to identify the factors moving sales, test response scenarios quickly, and allocate resources while demand and operating conditions changed rapidly.
BluePi connected store and operating data to SQL Server, Amazon EC2, Amazon EMR, and Microsoft Power BI, creating a cloud analytical path for sales-driver analysis, what-if scenarios, dashboards, and self-service exploration.
The platform went live in a matter of weeks. Sales drivers became visible, what-if analysis supported response planning, analysts gained self-service exploration, and the time from question to action decreased.
Store and operating data entered SQL Server and cloud collection before Amazon EC2 and Amazon EMR analysis. Sales-driver and what-if outputs reached Microsoft Power BI, where analysts and leaders used shared dashboards for resource-allocation and operating decisions.
Sales drivers and response scenarios moved into a shared analytical workflow. Business analysts could explore data directly, while leaders used dashboard evidence to allocate resources and respond to market changes.