
01 · Daily SAP extraction
An initial load and daily end-of-day deltas moved SAP procurement records into raw Redshift tables.
Customer work · Food services
Compass Group worked with inconsistent records and conflicting reports across SAP and related systems. BluePi integrated inventory, sales, and operational data on AWS Redshift, established master-data workflows and governance, and applied field-level quality controls.
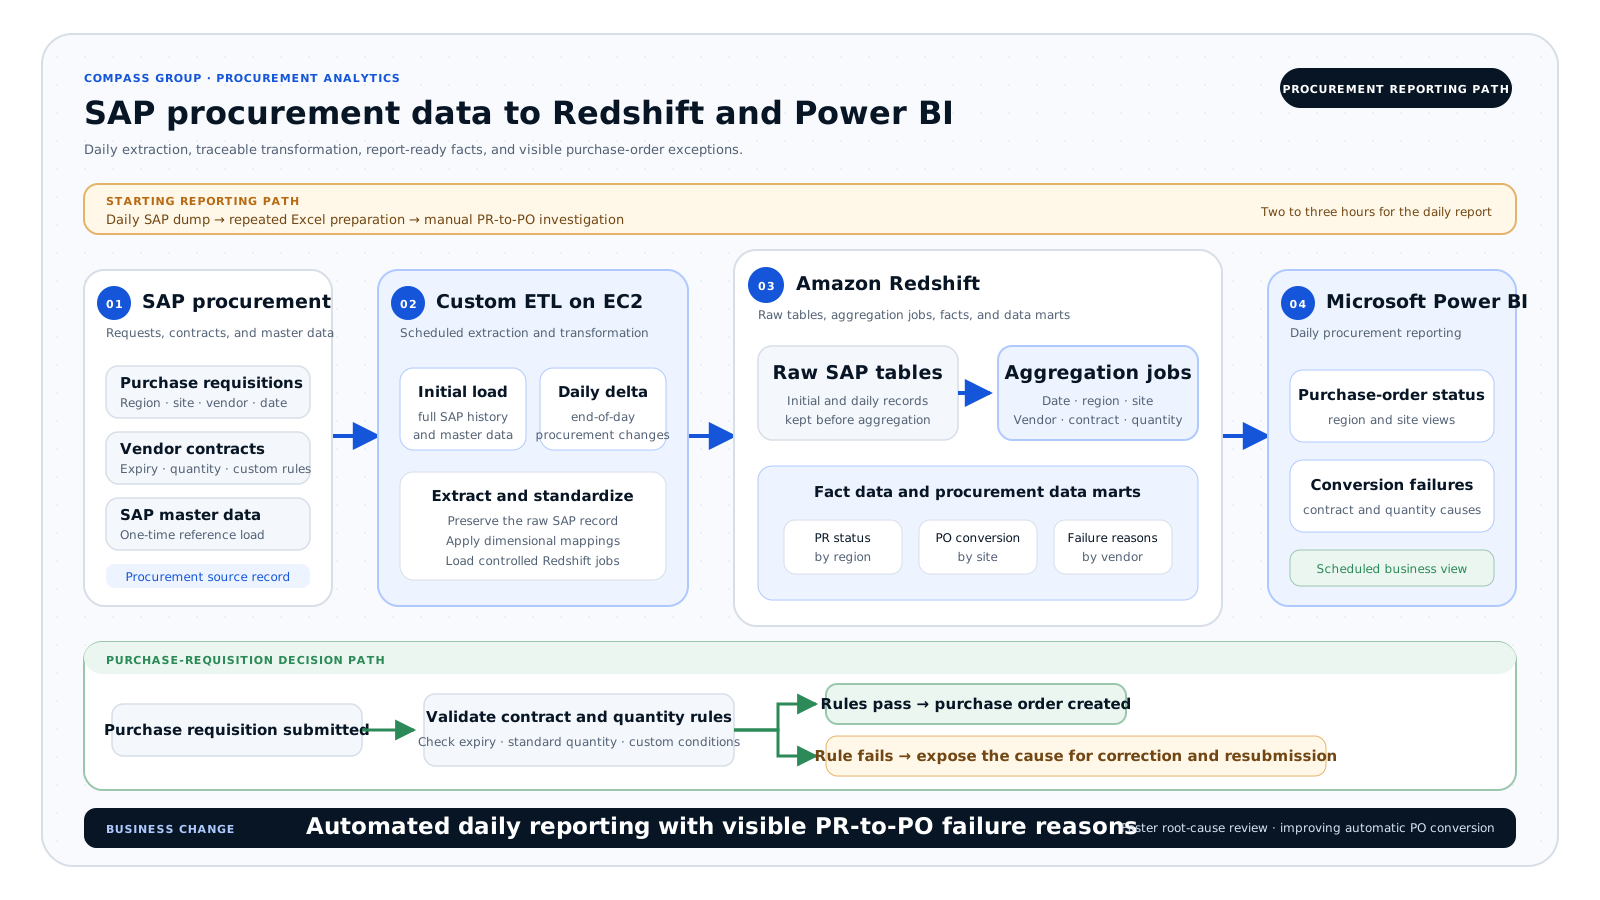
Compass Group teams exported SAP procurement data and spent two to three hours preparing a daily Excel report. BluePi introduced a scheduled path from SAP through custom ETL on Amazon EC2 into Amazon Redshift data marts and Power BI.
01 · Daily SAP extraction
An initial load and daily end-of-day deltas moved SAP procurement records into raw Redshift tables.
02 · Redshift facts and data marts
Aggregation jobs organized raw records by dimensions such as date, region, site, and vendor before loading report-ready facts.
03 · PR-to-PO failure analysis
Power BI showed purchase-order status and highlighted reasons a purchase requisition did not convert automatically.
SAP data entered the EC2 ETL path as an initial load and daily delta. Raw records landed in Redshift, aggregation jobs generated facts and data marts, and Power BI presented purchase-order status and failed-conversion reasons.
Initial and daily delta loads entered raw Redshift tables before reporting logic changed the data.
Aggregation jobs organized procurement data by dimensions including date, region, site, and vendor.
Power BI connected purchase-order status to the conditions that prevented automatic conversion so teams could correct the source issue.
Where this pattern fits
This case fits procurement teams that still export ERP data into spreadsheets to investigate purchase-requisition and purchase-order performance. BluePi can start with one daily report, its SAP inputs, transformation rules, and the decisions it supports.
Open a section to review the customer problem, implementation, business change, and architecture.
Duplicate records, hard mappings, and disconnected sources caused departments to report different numbers. The inconsistencies weakened analytics and made supply-chain and food-cost reporting difficult to trust.
BluePi integrated SAP inventory, SAP sales, and related operational sources, established a central master-data repository and workflows, defined governance standards, and applied field-level validation and quality rules for AWS Redshift reporting.
Compass Group gained standardized master records and more reliable reporting. Supply-chain activity and food costs could be reviewed from shared definitions instead of department-specific mappings and duplicate records.
SAP procurement data was extracted each day and loaded through custom ETL on Amazon EC2. Raw SAP tables entered Amazon Redshift before aggregation jobs organized facts by dimensions such as date, region, site, and vendor. Power BI used the resulting Redshift data marts to report purchase-order status and the reasons purchase requisitions did not convert automatically.
Teams moved from daily SAP dumps and repeated Excel work to scheduled reporting from Redshift data marts. Power BI made purchase-order status and failed-conversion reasons visible so departments could correct contract, quantity, and process issues.