01 · Dataflow collection and preparation
Dataflow pipelines collected records from sales, marketing, and operations systems, then cleaned and transformed them before loading the warehouse.
Customer work · Logistics
DTDC relied on manually assembled reports across sales, marketing, and operations systems. BluePi built a central Google Cloud reporting path with Dataflow pipelines, BigQuery, and Google Data Studio dashboards for MIS, bottleneck analysis, and senior-management KPIs.
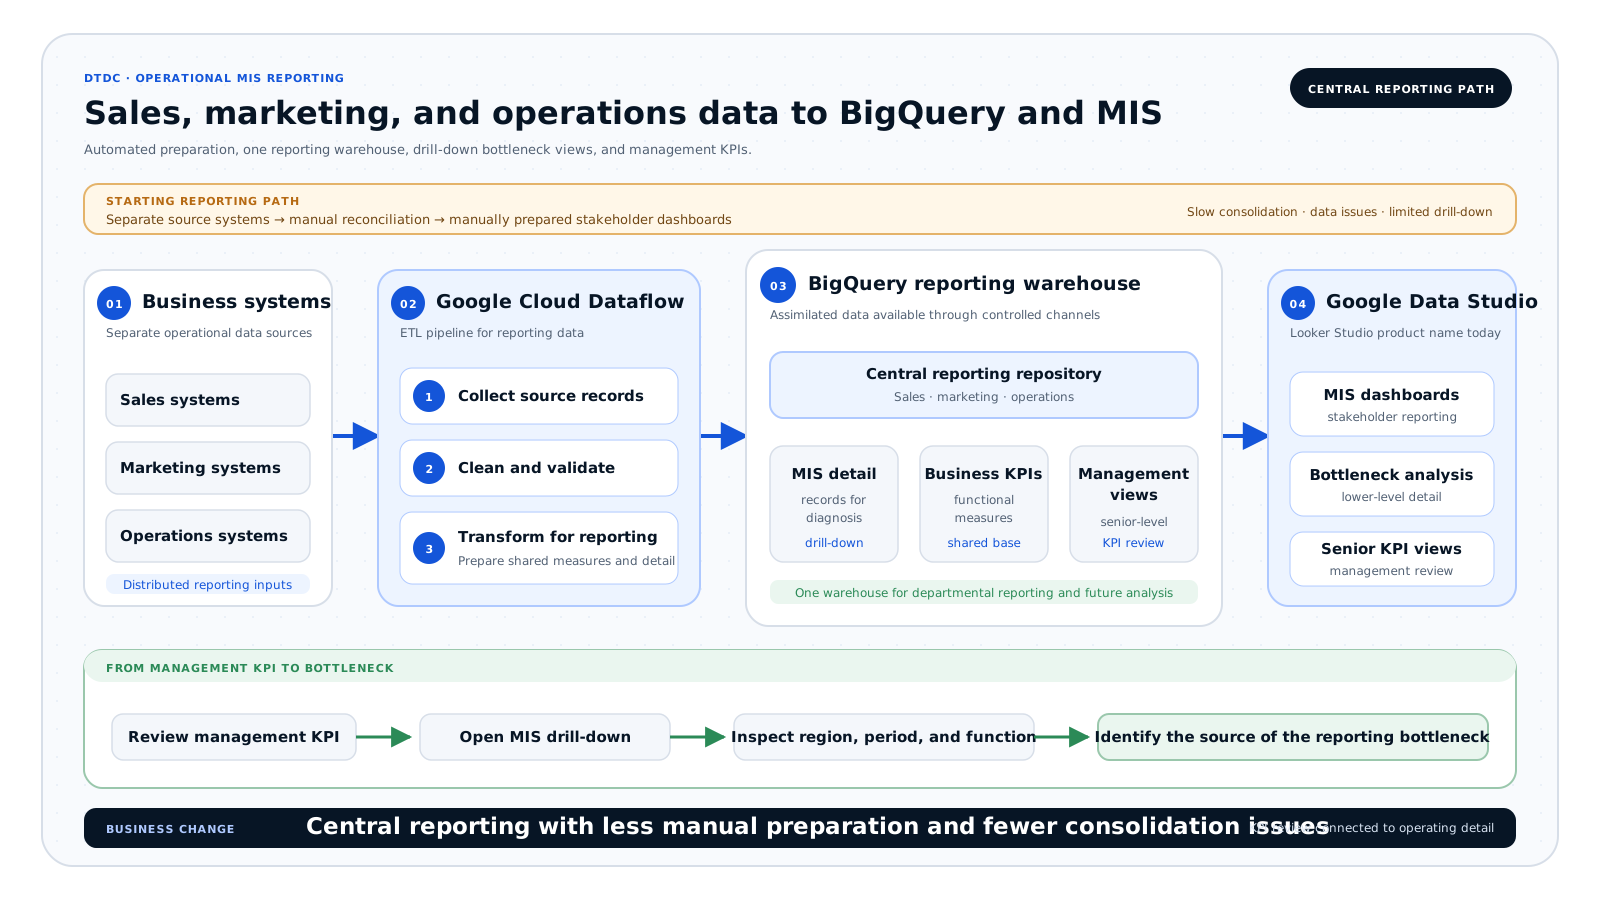
DTDC teams assembled and reconciled reports manually across separate systems. BluePi used Google Cloud Dataflow to collect, clean, and transform the data, BigQuery as the central warehouse, and Google Data Studio dashboards for MIS, bottleneck analysis, and senior-management KPIs.
01 · Dataflow collection and preparation
Dataflow pipelines collected records from sales, marketing, and operations systems, then cleaned and transformed them before loading the warehouse.
02 · BigQuery reporting warehouse
A central BigQuery repository gave departments secure access to assimilated data and a shared base for business KPIs and MIS reporting.
03 · MIS and KPI drill-down
Google Data Studio dashboards let users move from senior-management KPIs into the lower-level detail required to identify bottlenecks.
Sales, marketing, and operations records entered Dataflow collection, cleaning, and transformation pipelines. BigQuery stored the combined reporting data, and Google Data Studio served MIS dashboards, detailed bottleneck views, and senior-management KPIs.
Dataflow pipelines replaced repeated manual collection, cleaning, and transformation work across source systems.
BigQuery held assimilated data from sales, marketing, and operations systems and made it available through controlled reporting paths.
Google Data Studio dashboards let users move from high-level measures into the detail needed to identify and diagnose bottlenecks.
Where this pattern fits
This case fits logistics organizations that have reports but lack one dependable route from source data to MIS and management KPIs. BluePi can start with a bounded report set and trace each measure through source, transformation, quality, and owner.
Open a section to review the customer problem, implementation, business change, and architecture.
Data remained spread across sales, marketing, and operations systems. Reports were assembled manually, large data volumes made consolidation difficult, and stakeholders could not reliably move from a KPI into the detail behind it.
BluePi used Google Cloud Dataflow to collect, clean, and transform source data before loading BigQuery. Google Data Studio dashboards provided detailed MIS views, bottleneck analysis, and senior-management KPI reporting.
DTDC established a centralized reporting practice, reduced manual report preparation, reduced data issues introduced by manual consolidation, and gave stakeholders interactive access to current reporting data.
Sales, marketing, and operations systems fed Dataflow collection, cleaning, and transformation pipelines. BigQuery stored the assimilated reporting data, while Google Data Studio served detailed MIS dashboards, bottleneck analysis, and senior-management KPI views.
Teams spent less time assembling reports manually and introduced fewer data issues through consolidation. Stakeholders could move from management KPIs into the source detail required to investigate bottlenecks.