
01 · Streaming KPI inputs
PySpark streaming jobs on AWS EMR prepared raw and aggregate data for current operating measures.
Customer work · Quick-service restaurants
A multi-brand QSR operator relied on manual spreadsheet pivots and distributed reports for daily measures. BluePi built streaming and batch data paths, Snowflake reconciliation, Java APIs, and a custom React cockpit that brought KPI visibility to approximately one-minute latency.
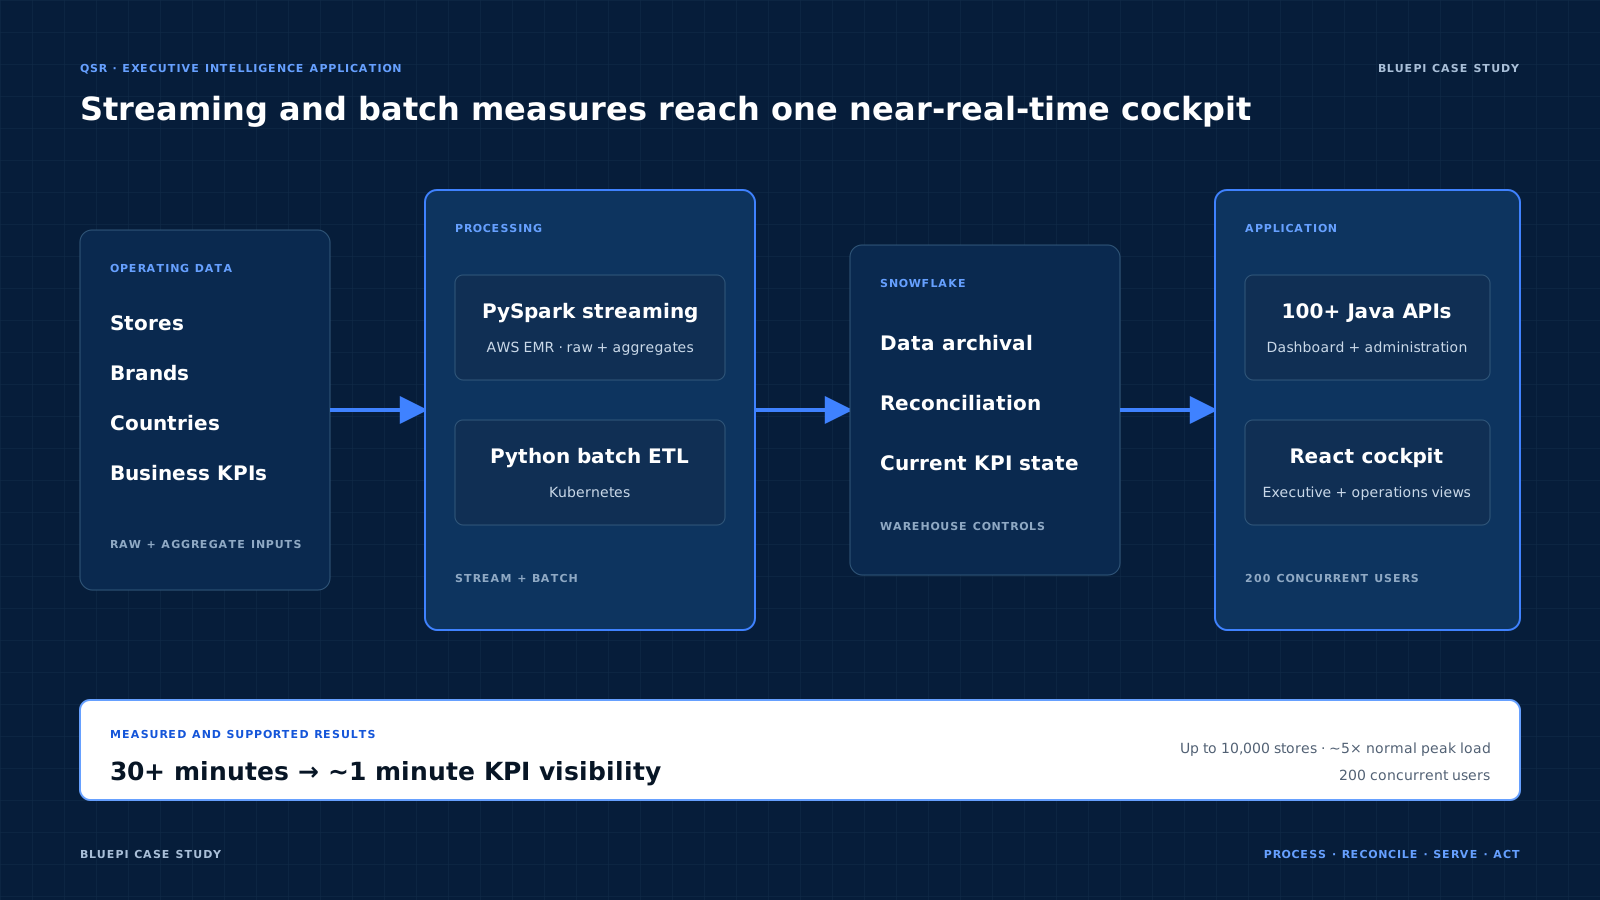
A multi-brand, multi-country QSR operator relied on spreadsheet pivots and reports spread across locations, with at least 30 minutes of latency and no central cockpit for daily measures. BluePi built streaming, batch, reconciliation, API, and React application paths for current KPI visibility.
01 · Streaming KPI inputs
PySpark streaming jobs on AWS EMR prepared raw and aggregate data for current operating measures.
02 · Reconciled warehouse state
Snowflake archival and reconciliation procedures supported consistency before measures reached the application.
03 · Executive cockpit delivery
More than 100 Java APIs and a custom React cockpit supported dashboard, administration, and operating views with approximately one-minute KPI latency.
BluePi processed raw and aggregate data through PySpark streaming on AWS EMR, handled Python batch ETL on Kubernetes, reconciled and archived data in Snowflake, served measures through Java APIs, and exposed them in a custom React cockpit.
Streaming and batch paths turned operating data into current KPI inputs.
Snowflake procedures supported archival and consistency before measures reached the application.
Java APIs and React connected dashboard, administration, and operating views.
Where this pattern fits
This case is relevant when QSR operations and leadership teams depend on manually assembled reports and cannot access current measures during the operating day.
Use these prompts to decide whether the case fits your operating problem and what a first deployment should prove.
A first engagement can connect one operating measure from source processing through reconciliation, API delivery, and a working cockpit view, then validate its latency and peak-load behavior.
Open a section to review the customer problem, implementation, business change, and architecture.
Operations and leadership teams waited at least 30 minutes to derive current insights. Reports lived in several locations, spreadsheet pivots remained manual, and no central executive cockpit connected the measures required for daily action.
BluePi connected streaming and batch data preparation, warehouse reconciliation, application APIs, administration, and one executive interface.
KPI visibility improved from at least 30 minutes to approximately one minute, while the application and infrastructure supported larger operating conditions.
Configurable KPIs and real-time KPI alerts and notifications are planned as the next capabilities.